The Holiday Subscription Report: making the data useful
 September 2026
- My role
- Report design lead and campaign contributor
- At a glance
- Report and promotion launched in September 2026.
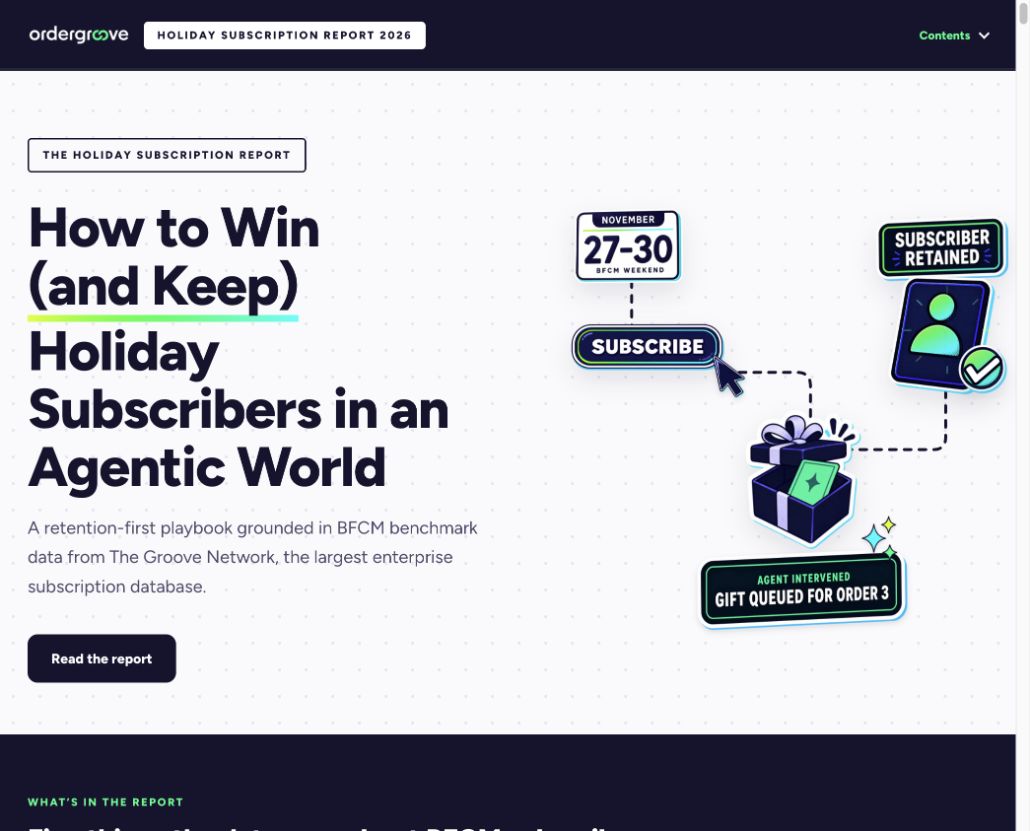
A holiday acquisition spike makes a good headline. What happens to those subscribers afterward is a more useful story. For Ordergroove’s 2026 Holiday Subscription Report, I helped turn subscription research into an interactive experience that connected the numbers to decisions a merchant could actually make before peak season.
Give a busy team a reason to keep reading
The audience was enterprise commerce and subscription teams preparing for Black Friday and Cyber Monday. They were already thinking about offers, acquisition costs, and the busiest weekend of the year. We wanted to bring retention into that planning conversation: how to protect existing subscribers and help newly acquired customers make it to another order.
That gave the project two jobs. Make the research understandable, then show what a brand could do with it. A long document of benchmarks would cover the first job only if someone made time to read it. I chose an interactive, long-scroll format so the argument, visual evidence, and next steps could live together.
My part in a shared campaign
I led the report’s design and worked across the research, narrative, interactive prototypes, and social rollout. The work was collaborative: product marketing and brand colleagues shaped the content, demand generation challenged the story and distribution, and our development partner supported implementation.
My job was to make those pieces work as one experience. I explored visual directions, built and revised page treatments, and worked through how the reader would move from a finding to a product example or practical action. I also developed social copy for the company and leadership team, giving different voices a relevant way into the same report.
Make the relationship between ideas visible
The design needed to explain movement over time: acquiring a subscriber, getting them through the early retention hurdle, and keeping the value of that relationship. I worked through visual treatments for the cohorts and the product sections so readers could follow the sequence without having to interpret a spreadsheet first.
The team kept revisiting where the payoff belonged. That was a useful editorial constraint. Each section needed to answer why a busy merchant should care before asking them to absorb another layer of detail.
Product examples had a specific role in the story. They connected a retention problem to an action, with the difference between an automated workflow and an agent-led recommendation made visible. The human review step mattered as much as the interface.
Use AI to explore, then make the call
I used AI-assisted prototyping to explore ways to turn the research into something interactive. Near launch, the calculator was not doing enough for the reader. I brought the dataset back into the exploration and developed alternatives, including a slider and a short diagnostic flow, for the team to review.
The value of that workflow was being able to put concrete options in front of colleagues and decide what helped. The finished report closes with a time-based readiness plan. Those explorations helped us work toward a practical next step for the reader.
A report built to work beyond launch day
The page went live in September 2026, with the navigation change and promotion push on September 14. The team shipped an interactive report that could anchor the campaign, support sales conversations, and give company and executive social content a shared evidence base.
My contribution was the experience around that evidence: the design, the prototypes, the connective story, and the campaign copy. Together, we made a published resource that carries a reader from a seasonal question to a retention plan.